Open House. Open House on Sunday, March 24, 2019 2:00PM - 4:00PM

Home listings continue to increase across all housing categories in the Metro Vancouver housing market while home buyer activity remains below historical averages.
The Real Estate Board of Greater Vancouver (REBGV) reports that residential home sales in the region totalled 1,103 in January 2019, a 39.3 per cent decrease from the 1,818 sales recorded in January 2018, and a 2.9 per cent increase from the 1,072 homes sold in December 2018.
Last month’s sales were 36.3 per cent below the 10-year January sales average and were the lowest January-sales total since 2009.
“REALTORS® are seeing more traffic at open houses compared to recent months. Homes priced well for today’s market are garnering interest, however, buyers are choosing to remain in a holding pattern for the time being,” Phil Moore, REBGV president said.
There were 4,848 detached, attached and apartment homes newly listed for sale on the Multiple Listing Service® (MLS®) in Metro Vancouver in January 2019. This represents a 27.7 per cent increase compared to the 3,796 homes listed in January 2018 and a 244.6 per cent increase compared to the 1,407 homes listed in December 2018.
The total number of homes currently listed for sale on the MLS® system in Metro Vancouver is 10,808, a 55.6 per cent increase compared to January 2018 (6,947) and a 5.2 per cent increase compared to December 2018 (10,275).
For all property types, the sales-to-active listings ratio for January 2019 is 10.2 per cent. By property type, the ratio is 6.8 per cent for detached homes, 11.9 per cent for townhomes, and 13.6 per cent for condominiums.
Generally, analysts say that downward pressure on home prices occurs when the ratio dips below the 12 per cent mark for a sustained period, while home prices often experience upward pressure when it surpasses 20 per cent over several months.
“Home prices have edged down across all home types in the region over the last seven months,” Moore said.
The MLS® Home Price Index composite benchmark price for all residential homes in Metro Vancouver is currently $1,019,600. This represents a 4.5 per cent decrease over January 2018, and a 7.2 per cent decrease over the past six months.
“Economic fundamentals underpinning our market for home buyers and sellers remain strong. Today’s market conditions are largely the result of the mortgage stress test that the federal government imposed at the beginning of last year,” Moore said. “This measure, coupled with an increase in mortgage rates, took away as much as 25 per cent of purchasing power from many home buyers trying to enter the market.”
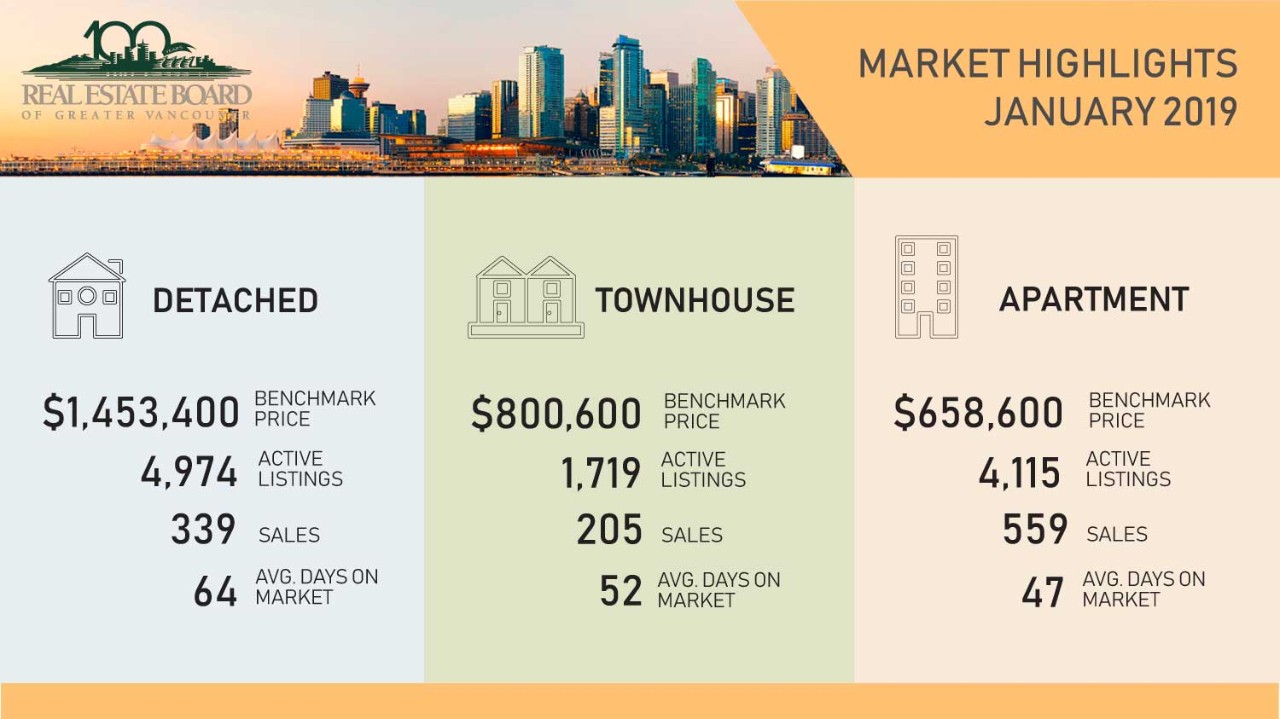
Sales of detached homes in January 2019 reached 339, a 30.4 per cent decrease from the 487 detached sales recorded in January 2018. The benchmark price for detached homes is $1,453,400. This represents a 9.1 per cent decrease from January 2018, and an 8.3 per cent decrease over the past six months.
Sales of apartment homes reached 559 in January 2019, a 44.8 per cent decrease compared to the 1,012 sales in January 2018. The benchmark price of an apartment property is $658,600. This represents a 1.7 per cent decrease from January 2018, and a 6.6 per cent decrease over the past six months.
Attached home sales in January 2019 totalled 205, a 35.7 per cent decrease compared to the 319 sales in January 2018. The benchmark price of an attached unit is $800,600. This represents a 0.5 per cent decrease from January 2018, and a 6.2 per cent decrease over the past six months.
Areas covered by the Real Estate Board of Greater Vancouver include: Whistler, Sunshine Coast, Squamish, West Vancouver, North Vancouver, Vancouver, Burnaby, New Westminster, Richmond, Port Moody, Port Coquitlam, Coquitlam, Pitt Meadows, Maple Ridge, and South Delta.
The real estate industry is a key economic driver in British Columbia. In 2018, 24,619 homes changed ownership in the Board’s area, generating $1.7 billion in economic spin-off activity and an estimated 11,720 jobs. The total dollar value of residential sales transacted through the MLS® system in Greater Vancouver totalled $26 billion in 2018.
Craig Munn
Manager, Communication
Real Estate Board of Greater Vancouver
604.730.3146
cmunn@rebgv.org
*Published with the permission of REBGV which compiled and presented the data.

Home buyer demand remains below long-term historical averages in the Metro Vancouver* housing market.
The Real Estate Board of Greater Vancouver (REBGV) reports that residential home sales totalled 1,608 in the region in November 2018, a 42.5 per cent decrease from the 2,795 sales recorded in November 2017, and an 18.2 per cent decrease compared to October 2018 when 1,966 homes sold.
Last month’s sales were 34.7 per cent below the 10-year November sales average and was the lowest sales for the month since 2008.
“Home buyers have been taking a wait-and-see approach for most of 2018. This has allowed the number of homes available for sale in the region to return to more typical historical levels,” Phil Moore, REBGV president said. “This activity is helping home prices edge down, across all property types, from the record highs we’ve experienced over the last year.”
There were 3,461 detached, attached and apartment homes newly listed for sale on the Multiple Listing Service® (MLS®) in Metro Vancouver in November 2018. This represents a 15.8 per cent decrease compared to the 4,109 homes listed in November 2017 and a 29 per cent decrease compared to October 2018 when 4,873 homes were listed.
The total number of homes currently listed for sale on the MLS® system in Metro Vancouver is 12,307, a 40.7 per cent increase compared to November 2017 (8,747) and a 5.2 per cent decrease compared to October 2018 (12,984).
For all property types, the sales-to-active listings ratio for November 2018 is 13.1 per cent. By property type, the ratio is 8.9 per cent for detached homes, 14.7 per cent for townhomes, and 17.6 per cent for apartments.
Generally, analysts say that downward pressure on home prices occurs when the ratio dips below the 12 per cent mark for a sustained period, while home prices often experience upward pressure when it surpasses 20 per cent over several months.
“Home prices have declined between four and seven per cent over the last six months depending on property type. We’ll watch conditions in the first quarter of 2019 to see if home buyer demand picks up ahead of the traditionally more active spring market,” Moore said.
The MLS® Home Price Index composite benchmark price for all residential properties in Metro Vancouver is currently $1,042,100. This represents a 1.4 per cent decrease over November 2017 and a 1.9 per cent decrease compared to October 2018.
Detached home sales in November 2018 reached 516, a 38.6 per cent decrease from the 841 detached sales recorded in November 2017. The benchmark price for detached homes is $1,500,100. This represents a 6.5 per cent decrease from November 2017 and a 1.6 per cent decrease compared to October 2018.
Apartment home sales reached 810 in November 2018, a 46.3 per cent decrease compared to the 1,508 sales in November 2017. The benchmark price of an apartment property is $667,800. This represents a 2.3 per cent increase from November 2017 and a 2.3 per cent decrease compared to October 2018.
Attached home sales in November 2018 totalled 282, a 36.8 per cent decrease compared to the 446 sales in November 2017. The benchmark price of an attached home is $818,500. This represents a 2.6 per cent increase from November 2017 and a 1.3 per cent decrease compared to October 2018.
Areas covered by the Real Estate Board of Greater Vancouver include: Whistler, Sunshine Coast, Squamish, West Vancouver, North Vancouver, Vancouver, Burnaby, New Westminster, Richmond, Port Moody, Port Coquitlam, Coquitlam, Pitt Meadows, Maple Ridge, and South Delta.
The real estate industry is a key economic driver in British Columbia. In 2017, 35,993 homes changed ownership in the Board’s area, generating $2.4 billion in economic spin-off activity and an estimated 17,600 jobs. The total dollar value of residential sales transacted through the MLS® system in Greater Vancouver totalled $37 billion in 2017.
|
|||||||||||||||
|
|||||||||||||||
|
|||||||||||||||
|
|||||||||||||||
|
|||||||||||||||
|
|||||||||||||||
|
|||||||||||||||
|
|||||||||||||||
|
|||||||||||||||
|
|||||||||||||||
|
|||||||||||||||
|
Home sale activity across Metro Vancouver* remained below long-term historical averages in October.
The Real Estate Board of Greater Vancouver (REBGV) reports that residential home sales in the region totalled 1,966 in October 2018, a 34.9 per cent decrease from the 3,022 sales recorded in October 2017, and a 23.3 per cent increase compared to September 2018 when 1,595 homes sold.
Last month’s sales were 26.8 per cent below the 10-year October sales average.
“The supply of homes for sale today is beginning to return to levels that we haven’t seen in our market in about four years,” Phil Moore, REBGV president said. “For home buyers, this means you have more selection to choose from. For sellers, it means your home may face more competition, from other listings, in the marketplace.”
There were 4,873 detached, attached and apartment homes newly listed for sale on the Multiple Listing Service® (MLS®) in Metro Vancouver in October 2018. This represents a 7.4 per cent increase compared to the 4,539 homes listed in October 2017 and a 7.7 per cent decrease compared to September 2018 when 5,279 homes were listed.
The total number of homes currently listed for sale on the MLS® system in Metro Vancouver is 12,984, a 42.1 per cent increase compared to October 2017 (9,137) and a 0.8 per cent decrease compared to September 2018 (13,084).
For all property types, the sales-to-active listings ratio for October 2018 is 15.1 per cent. By property type, the ratio is 10.3 per cent for detached homes, 17.3 per cent for townhomes, and 20.6 per cent for condominiums.
Generally, analysts say that downward pressure on home prices occurs when the ratio dips below the 12 per cent mark for a sustained period, while home prices often experience upward pressure when it surpasses 20 per cent over several months.
“Home prices have edged down between three and five per cent, depending on housing type, in our region since June,” said Moore. “This is providing a little relief for those looking to buy compared to the all-time highs we’ve experienced over the last year.”
The MLS® Home Price Index composite benchmark price for all residential homes in Metro Vancouver is currently $1,062,100. This represents a one per cent increase over October 2017 and a 3.3 per cent decrease over the last three months.
Sales of detached homes in October 2018 reached 637, a 32.2 per cent decrease from the 940 detached sales recorded in October 2017. The benchmark price for detached properties is $1,524,000. This represents a 5.1 per cent decrease from October 2017 and a 3.9 per cent decrease over the last three months.
Sales of apartments reached 985 in October 2018, a 35.7 per cent decrease compared to the 1,532 sales in October 2017. The benchmark price of an apartment property is $683,500. This represents a 5.8 per cent increase from October 2017 and a 3.1 per cent decrease over the last three months.
Attached homes sales in October 2018 totalled 344, a 37.5 per cent decrease compared to the 550 sales in October 2017. The benchmark price of an attached home is $829,200. This represents a 4.4 per cent increase from October 2017 and a 2.8 per cent decrease over the last three months.
Areas covered by the Real Estate Board of Greater Vancouver include: Whistler, Sunshine Coast, Squamish, West Vancouver, North Vancouver, Vancouver, Burnaby, New Westminster, Richmond, Port Moody, Port Coquitlam, Coquitlam, Pitt Meadows, Maple Ridge, and South Delta.
|
|||||||||||
|
|||||||||||
|
|||||||||||
|
|||||||||||
|
|||||||||||
|
|||||||||||
|
|||||||||||
|
|||||||||||
|
Welcome to OXFORD on Hastings, your opportunity to be a part of one of Vancouver’s hottest, fastest growing neighbourhoods - The East Village. You are steps from some of the city’s best dining, entertainment and recreation locations and just a short distance from Commercial Drive, Chinatown and the Downtown core. Local shops and services, including Tacofino, Campagnolo Roma, Parallel 49 Brewery, Bosa Foods and Donald’s Market are just some of the amenities and destinations available to you in the village. Schools, Community Centres and great transportation options round out this community’s profile.
You’ll fall in love with this modern, open concept 2 bedroom + Flex, 2 bathroom Penthouse level suite featuring over- height ceilings, a gourmet kitchen, in-suite laundry, integrated Fisher-Paykel and Blomberg appliances, modern high-gloss cabinetry with quartz countertops and a private Master suite with walk-in closet. An energy efficient A/C system for year around in-suite comfort was a developer upgrade and the homeowners have installed custom built-ins and closet organizers to keep you on top of your awesome game.
A large balcony accessed off the Living Room and Master Bedroom is perfect for enjoying your morning coffee or a BBQ with friends after work while taking in the views of Downtown Vancouver and Strathcona to the southwest.
You will feel at home in this fabulous boutique residence with friendly, welcoming neighbours.